Whether you are managing a TikTok account for your brand or simply working with influencers on the platform to create branded content, you’ll want to understand TikTok’s available analytics and how to interpret them in order to perfect your TikTok marketing strategy. So let’s break down everything TikTok analytics!
How To Access TikTok Analytics
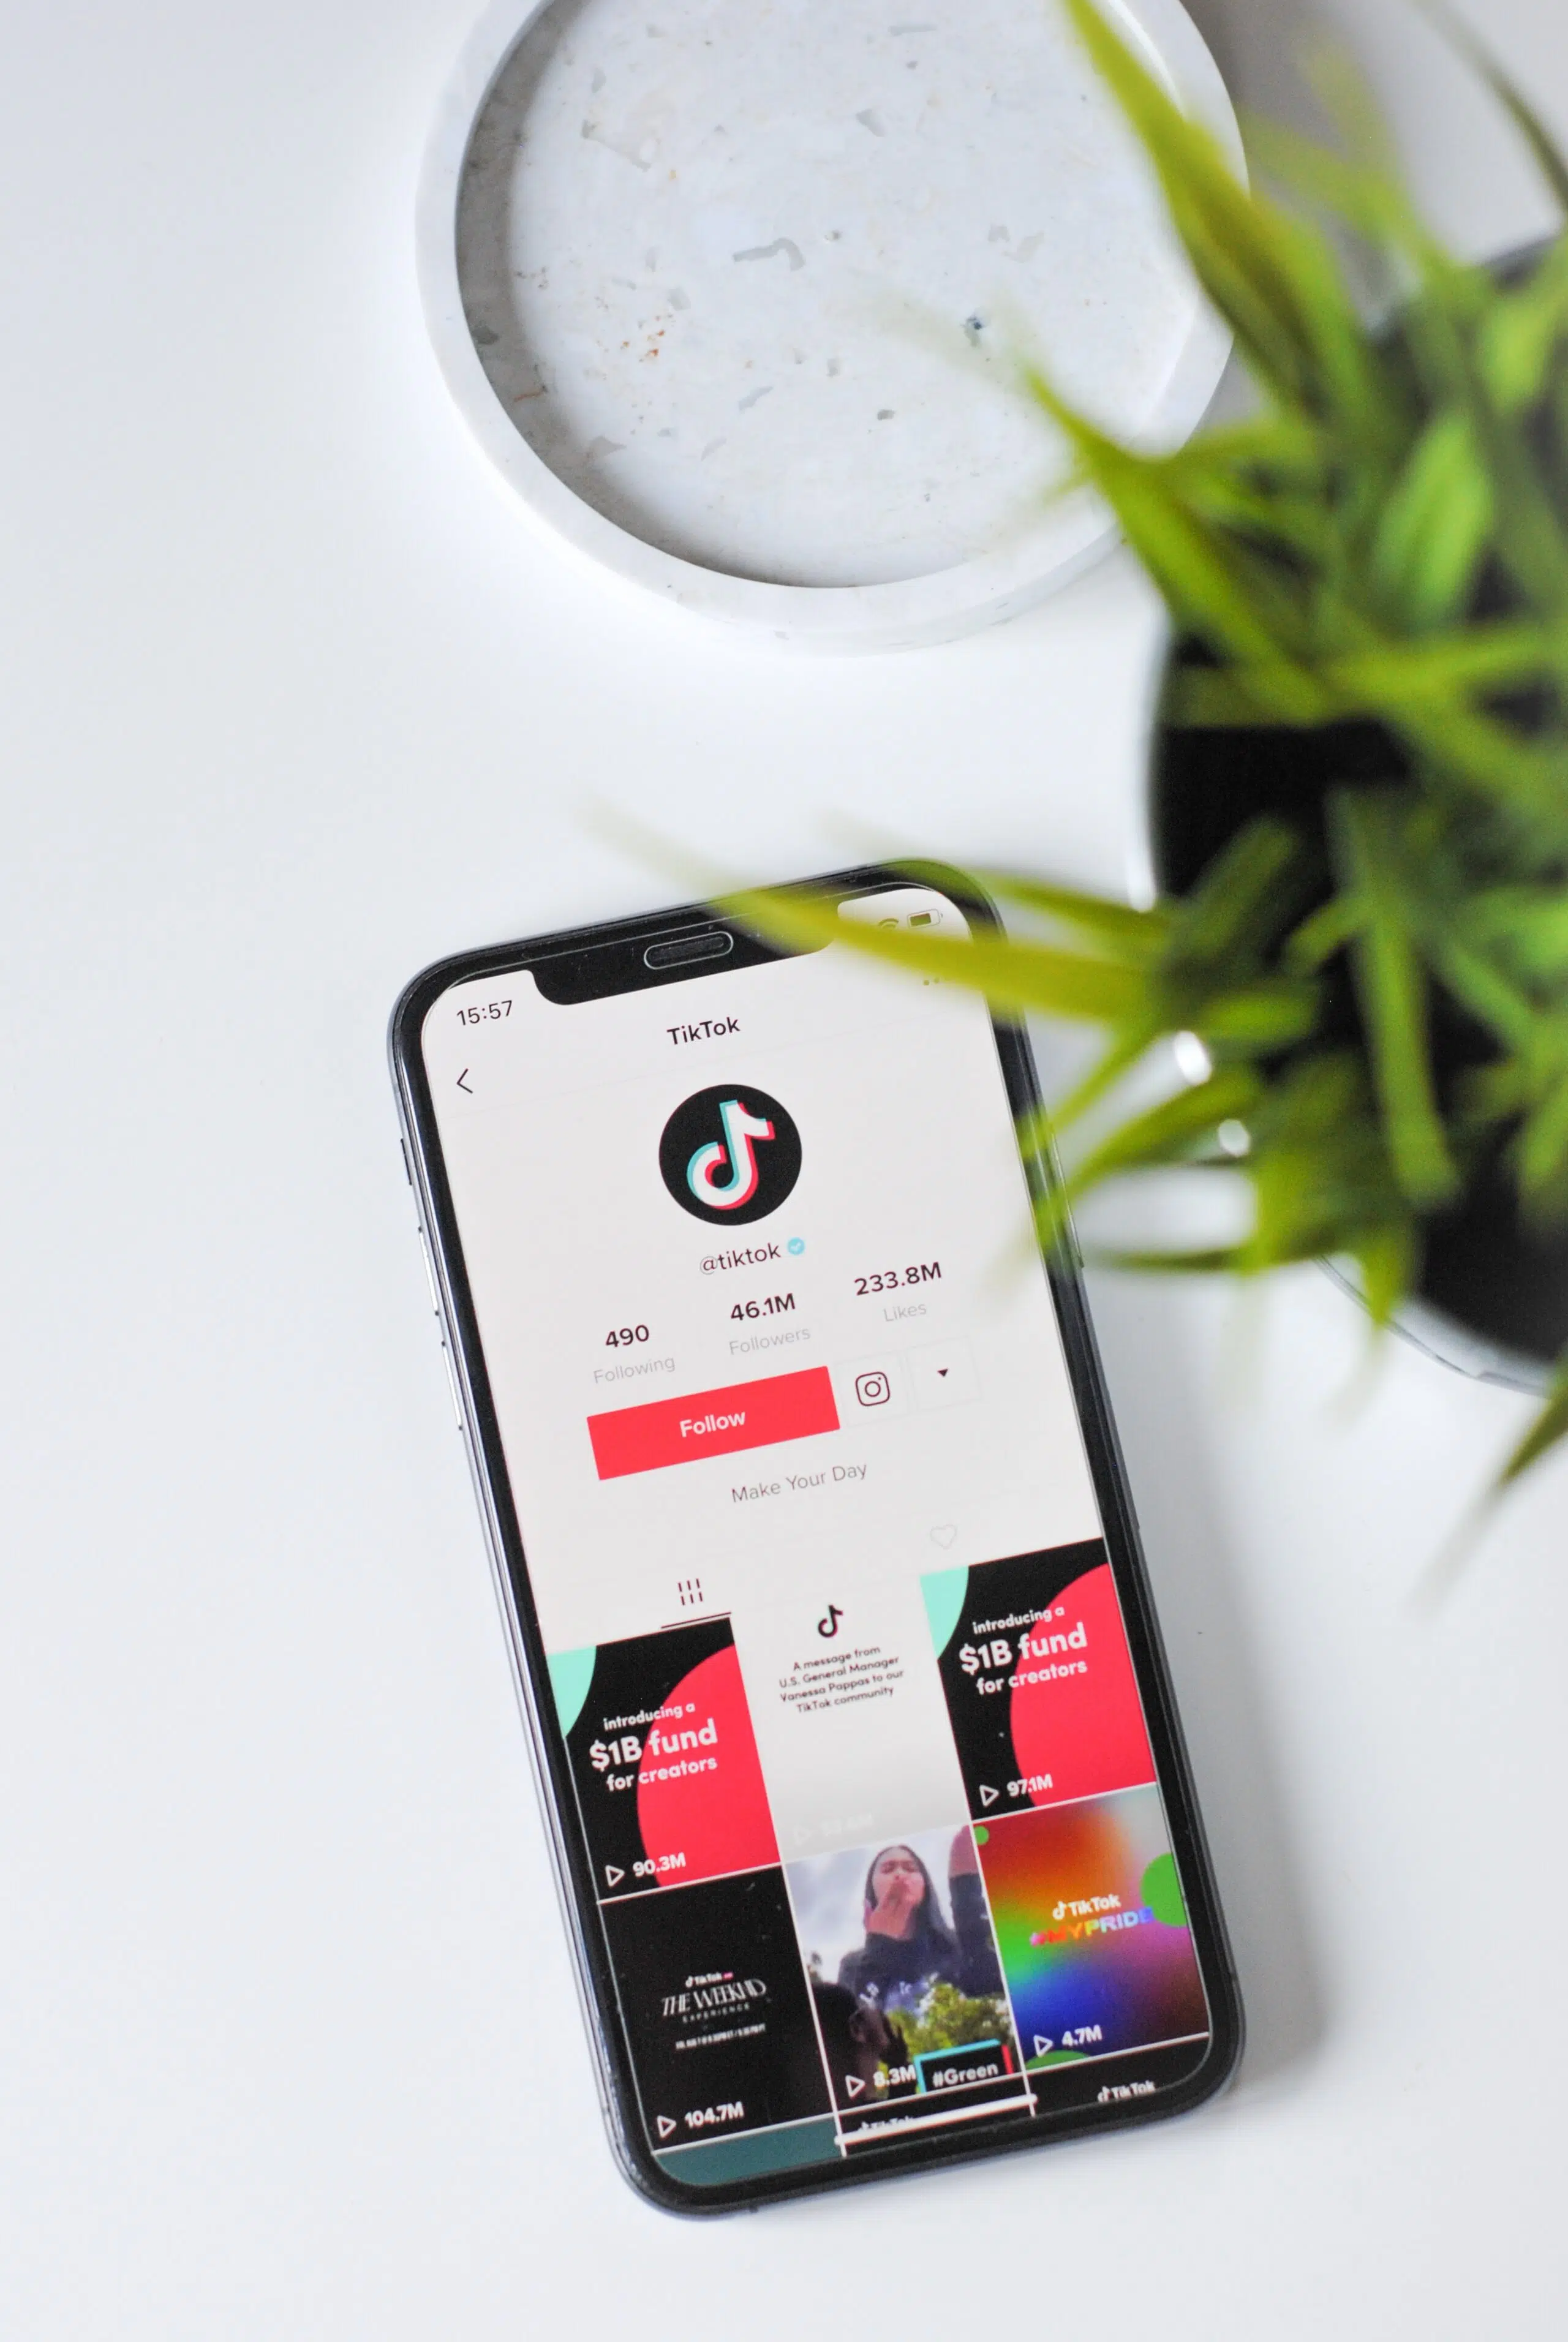
First: how do you access TikTok analytics?
You’ll need a Creator or Business Account on TikTok (don’t worry, it’s free) to view analytics. Heads up: you’ll only be able to access analytics for content after you sign up for a professional account. So go ahead, visit your settings, and switch ASAP so you’ll have access to metrics.
Now that you have your Creator or Business Account set up, you can access your analytics. Go to your profile, click the 3 horizontal lines in the top right corner, select “Creator Tools” then click “Analytics”. You can now see your TikTok analytics overview.
Understanding Your Analytics Dashboard
There are 4 main tabs under your analytics: Overview, Content, Followers, and LIVE. Each tab provides important data for you to understand your account performance. Let’s take a deeper dive:
Overview
Overview shows the Key Metrics of your account analytics over a given period of time. The default is “Last 7 Days”, but you can also view “Last 28 Days”, “Last 60 Days”, or enter a custom date range. Key metrics include:
Video Views: how many times viewers watched all videos on your profile in a given time period
Profile Views: the number of times your profile was viewed in the given time period
Likes: the number of likes your videos received in the given time period
Comments: the number of comments your videos received in the given time period
Unique Viewers: how many unique accounts watched your videos in the given time period
Shares: the number of times your video was shared in the given time period
TikTok will also show a comparison of how your metrics compare to the previous period’s performance so you can see your growth rate for those metrics.
Content
This is where you can see view numbers for recent posts and also find your Trending Videos.
The Video Posts section is pretty self-explanatory; it shows you all the videos you’ve posted in the past 7 days, their view numbers, and compares your number of posts to the previous 7 day period.
Below you’ll find the Trending Videos section, which is really valuable for you to understand what content of yours is performing best. This section shows the top 9 videos with the fastest growth in view numbers over the past 7 days.
How to use this data: Take a look at these videos and try to identify any trends or commonalities: maybe a certain topic you’re posting about is performing really well, or perhaps you started a trend that’s garnering a lot of engagement. Look at your popular videos and lean into that content!
Followers
This tab is where you can access demographics on your followers, as well as how your followers interact with other TikTok content.
First, you’ll see your follower count and growth rate over the past week. You can use this to track increases in following.
Below, you’ll see a pie chart illustrating the gender of your followers, a chart showcasing the percentage breakdown of age ranges of your followers, the top countries and regions your followers come from, and the top cities your followers come from.
Pro tip: Depending on where your followers are from, you may want to consider ensuring your content is accessible and relatable to international audiences. For example, adding translated captions if you have a large international following.
Further down, you’ll see Follower Activity that shows when your followers are most active on the platform, both by hour and by day.
Pro tip: this data is all recorded in UTC, so adjust for your time zone to understand when the best posting times are for your audience. (And if we’re being honest, we wouldn’t worry too much about posting at specific optimized times, as TikTok’s algorithm boosts content old and new alike to the “For You Page”).
LIVE
This tab specifically shares analytics regarding live stream content on TikTok. You have the option to view data for LIVE sessions up to 60 days of analytics.
First, you’ll be provided with an overview of LIVE video data, including the number of LIVE videos hosted, the total number of views, new followers, total time of LIVE videos, and top viewer count.
Below that, you’ll also see how many unique viewers have watched your LIVE videos at least once.
Last, you’ll see how many “diamonds” (aka digital gifts viewers can send you during LIVE videos that can be redeemed for money) you’ve earned during LIVE videos.
Viewing Individual TikTok Video Analytics
Now that you have a better understanding of your account analytics, let’s talk analytics for specific videos!
To view your video’s analytics, click on your video and click the 3 dots on the lower right corner. One of your options will be “Analytics”, so go ahead and click that. You’ll now be able to see your video’s performance, as well as a second tab for viewer demographics for the specific video.
Engagement Icons
At the top, you’ll see 5 icons with numbers below each: a play button, a heart, a comment bubble, an arrow, and a bookmark:
The play button represents the total number of views the video has received.
The heart represents how many likes the video has received.
The comment bubble represents how many comments have been made under your video.
The arrow represents how many times the video has been shared (which includes link copies and DM shares).
The bookmark icon represents how many times the video has been saved to Favorites.
Video Viewership
The next section displays total play time (in hours), average watch time, the percentage of viewers who watched the full video, and new followers gained from the video.
Pro tip: Average watch time is one of the most important metrics on TikTok and can make or break a video’s frequency on the FYP. A short average watch time means that viewers aren’t interested enough in the video’s content to watch through to the end. A high one, on the other hand, means your video is doing a great job keeping people engaged. Make note of your videos with high average watch times vs. low ones. Then strategize different ways of getting information across if you’re seeing consistently low watch times.
The following section features total video views with a graph showcasing video performance over time. This can help you understand the longevity of your video’s performance. Try to make note of peaks in video viewership and see if there are any insights you can make regarding trending topics.
Below that is a section that provides insights into the top words used in the video’s comment section. This can help you identify popular keywords to feature in future content.
Engagement
Next are two charts highlighting Engagement by Retention (the percentage of your viewers who are watching your video at a particular time in the video) and Likes (the percentage of viewers who liked your video at a particular time in the video). If you click “View Details” you can view these Engagement charts layered over your video so you can easily see where viewers are dropping off and when they are Liking your video.
Traffic Source Types
The next section showcases traffic source types, aka how users are finding your content. Your viewers can find your videos from the following sources:
For You
Personal Profile
Following
Sound
Search
Other
We can then head o the Viewers tab which breaks down the demographics of the video’s viewership.
The top lists the total Viewers for the video. Note that this is listing unique viewers.
Below that, you can view your viewership demographics for the specific video. This is broken down by Gender, Age, and Top Locations (by Country and City). These insights can help you understand how an individual video is performing and who it is resonating most with.
Now that you have a better understanding of TikTok’s analytics, you can now interpret content performance both from your brand’s account and from influencer partners and create a successful future TikTok strategy.
Have more questions about TikTok or interested in running a TikTok influencer campaign? Work with The Digital Dept. to plan your next TikTok campaign.